Skip to content

Choose what you want to know

1

Operational Pool Guide

Read the quick guide to understand how the Operational Pool works.

2

Technical Platform Guide

Explore the full platform features step by step.
ClearPool full platform overview
Pool Guide

Understand the Operational Pool

This section explains the operating model in a direct way.

Back to choice

01

Demo start and Real mode

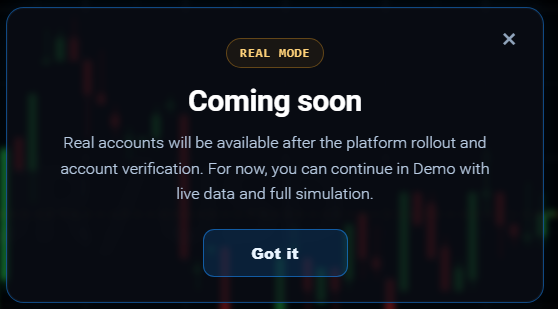
When you open the platform, Demo mode starts in USD by default. The demo balance starts at 50 and the Pool starts at 1,000. If you click Real, you see a coming soon message.

Demo mode, balance and Deposit in the topbar.
Look here: Demo mode opens by default in USD and the Deposit button is always visible in the topbar.
Real mode is shown as coming soon.
Check this: for now Real is not active yet, so clicking it shows a coming soon message.
02

Operational Pool, Mine / Pool and rules

Look at the Pool panel to see the current Pool value, the percentage of pool for the selected stake, the Mine / Pool switch and the latest operational notes.
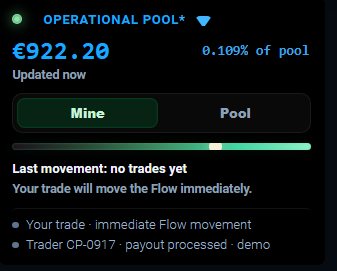
Operational Pool panel.
Focus here: this panel shows the Pool value, the selected amount as a percentage of pool, and the Mine / Pool switch.
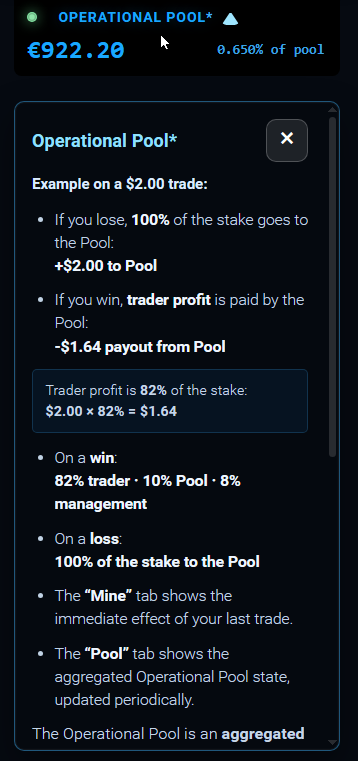
Detailed Pool rule example.
Read this example: it explains how wins and losses affect the Pool and how the 82 / 10 / 8 logic is applied.
03

Distribution, payout and trade progress

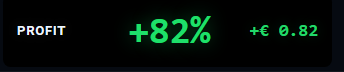
You can immediately see how profit is displayed, how the 82 / 10 / 8 split is presented, and how the progress bar follows an active trade until expiry.
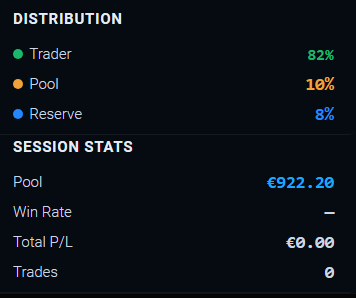
Distribution and session stats.
Trader, Pool and Reserve are displayed together with the live session stats.
Profit and payout panel.
The platform shows the payout percentage and the expected value for the current amount.
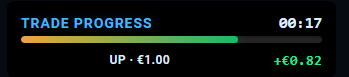
Trade progress during an active trade.
Direction, stake and remaining time are updated while the trade is active.
04

Top-up logic and trade action

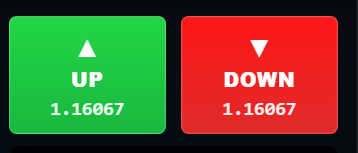
Deposit is locked until the demo balance goes below 10. When it unlocks, the top-up restores the demo balance to 50. Use UP or DOWN to choose your trade direction.
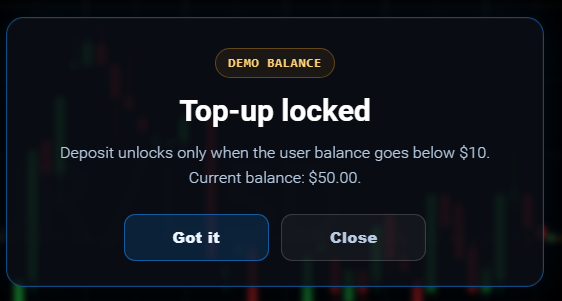
Top-up locked while the balance is above the threshold.
Important: this message explains that top-up becomes available only when the demo balance goes below 10.
UP and DOWN trade buttons.
Choose UP if you expect a rise, DOWN if you expect a fall.
Technical Platform Guide

Platform features step by step

This section is focused on the platform itself. Key screenshots, such as favorites, are given more space when needed so they feel closer to what you really see inside the platform.

Back to choice

01

Login and registration

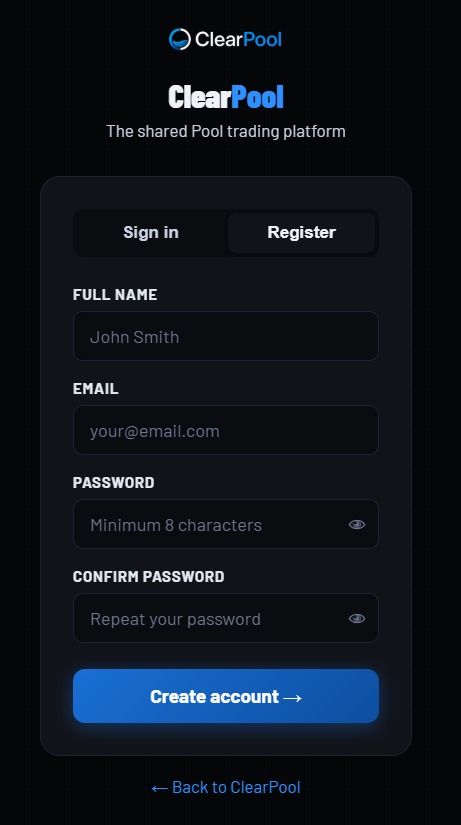
You can sign in with email and password, or create a new account with name, email, password and password confirmation.
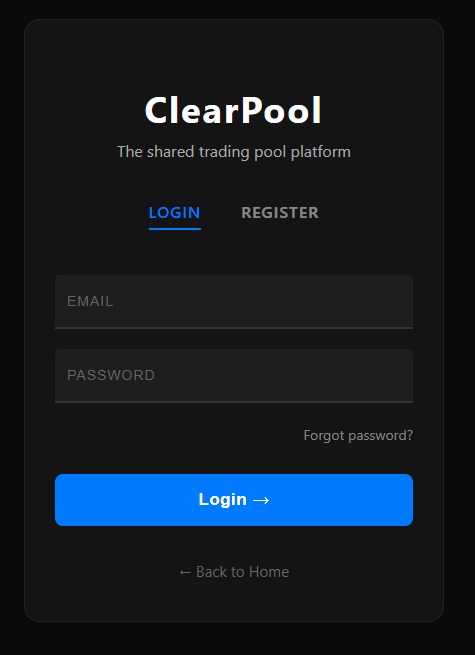
Login screen.
Login screen.
This is the login page.
Registration form.
Registration form.
This is the registration page for new accounts.
02

Main platform overview

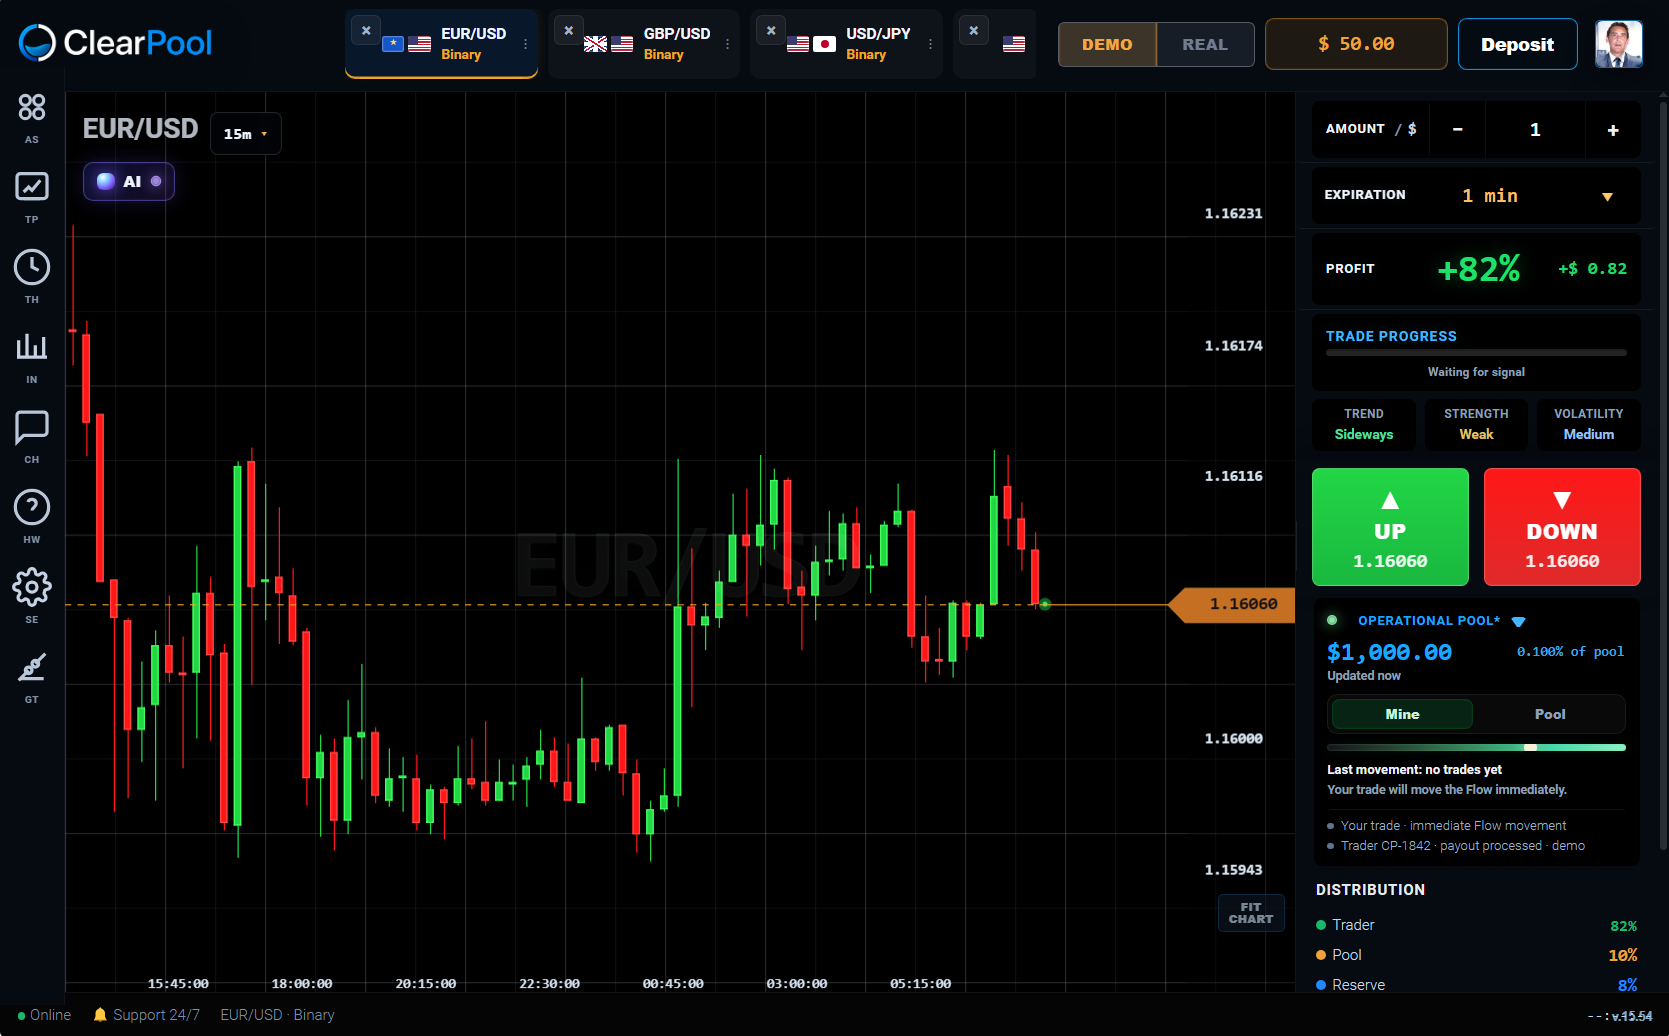
This is the main operating screen. The chart is in the center, navigation is on the left, the trading panel is on the right, and favorite assets stay in the topbar.

Main platform overview.
This full screenshot gives you the complete view of the platform layout.
03

Sidebar navigation

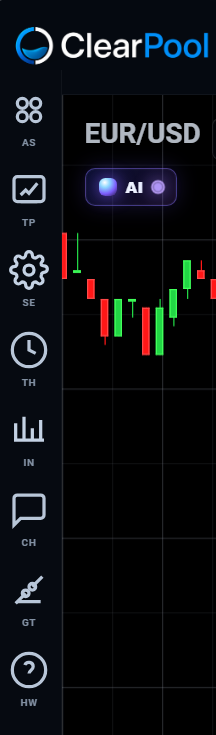
Use the left sidebar to open platform areas such as assets, portfolio, history, indicators, support, settings, graphic tools and How It Works.
Sidebar navigation.
Sidebar navigation.
Each icon opens a specific section of the platform.
04

Favorite assets topbar

Add assets to favorites with the star, close them with X and reorder them by dragging.

Favorite assets topbar.
Favorite assets stay on top so you can switch quickly between instruments.
05

Asset selection panel

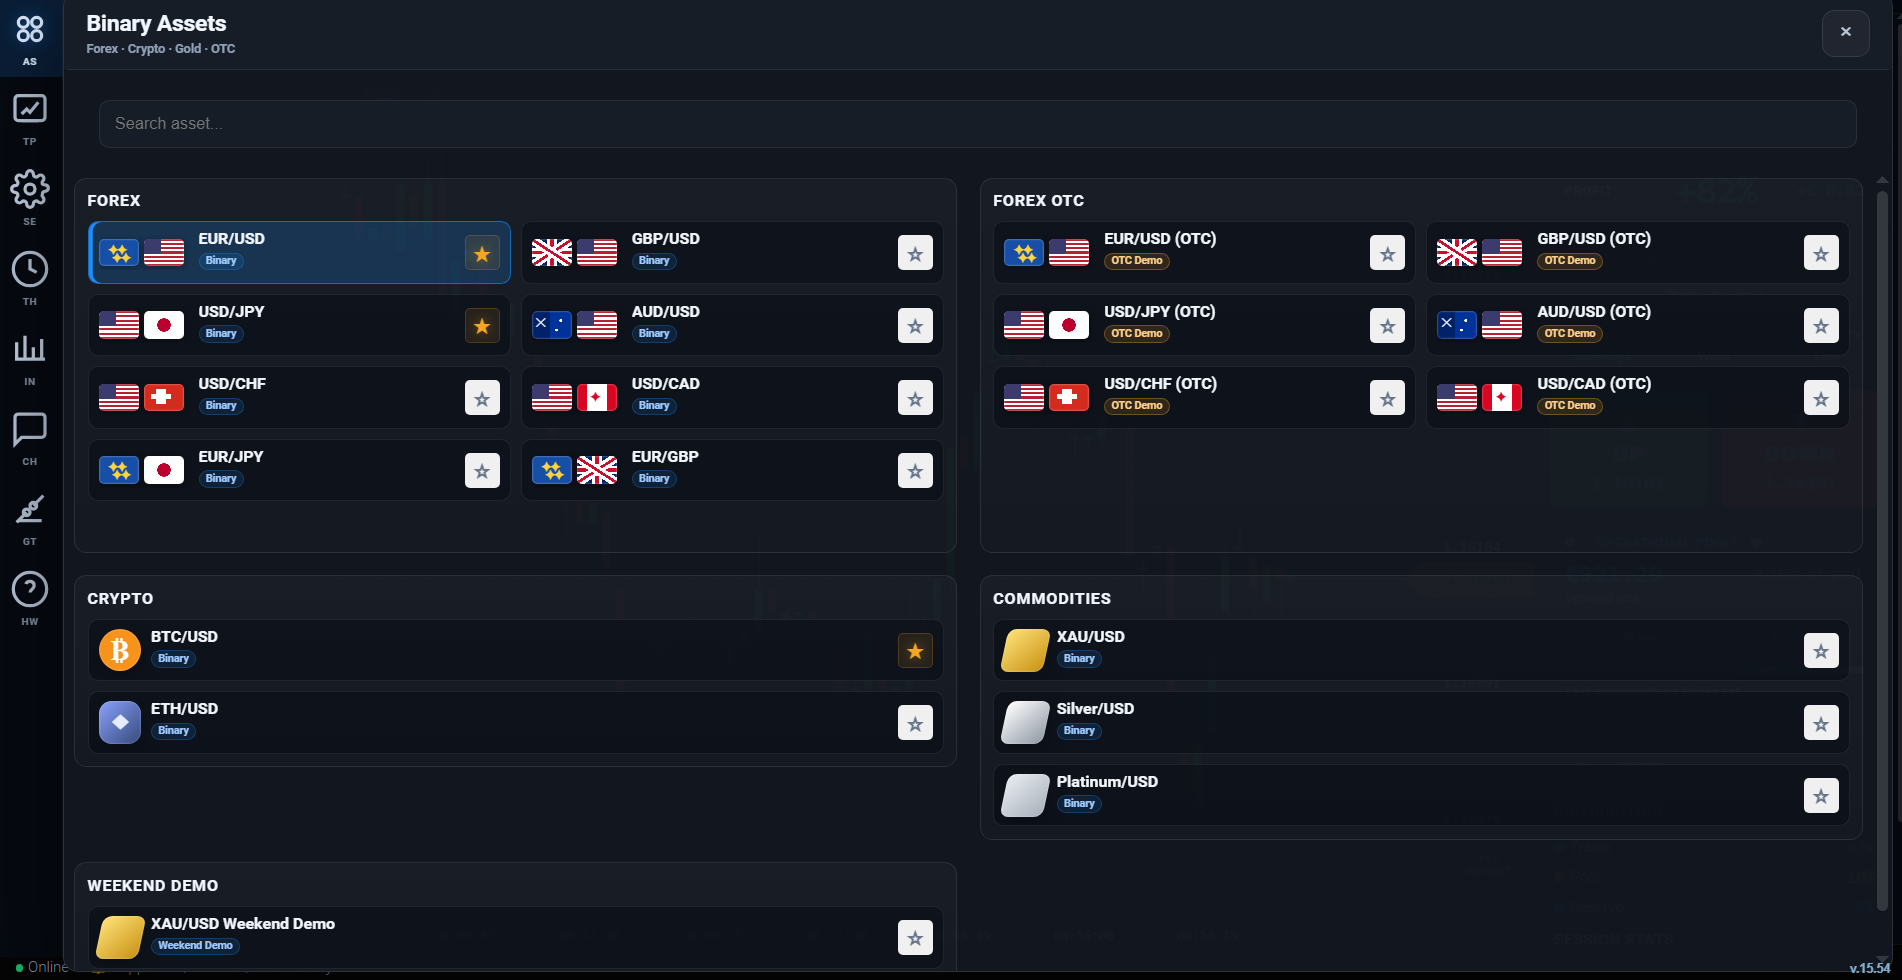
Choose an asset from Forex, Forex OTC, Crypto, Commodities or Weekend Demo.
Asset selection panel.
Use the search and the categories to choose the instrument you want to trade.
06

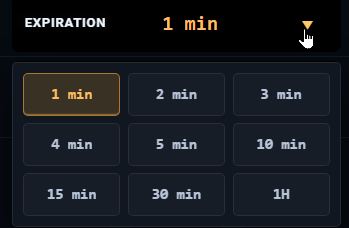
Timeframe, expiration and amount

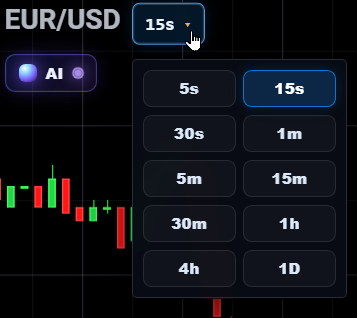
Open the timeframe menu, choose the trade duration from Expiration and adjust the amount with plus and minus controls.
Timeframe selector.
Timeframe selector.
Choose the chart timeframe from 5 seconds up to 1 day.
Expiration dropdown.
Set the trade duration here.
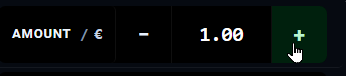
Trade amount control.
Use plus and minus to change the stake amount.
07

Market conditions and chart entries

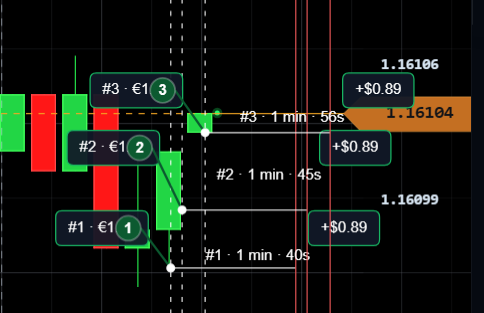
Check Trend, Strength and Volatility, then monitor entry markers directly on the chart when trades are opened.

Trend, Strength and Volatility.
These values help you read the current market context.
Trade entry markers on the chart.
Each trade appears on the chart with numbered markers and reference lines.
08

Trade result, portfolio and history

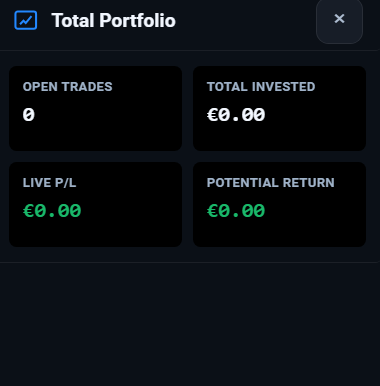
After expiry, the result appears on the chart. You can review open trades in Total Portfolio and closed trades in Trading History.
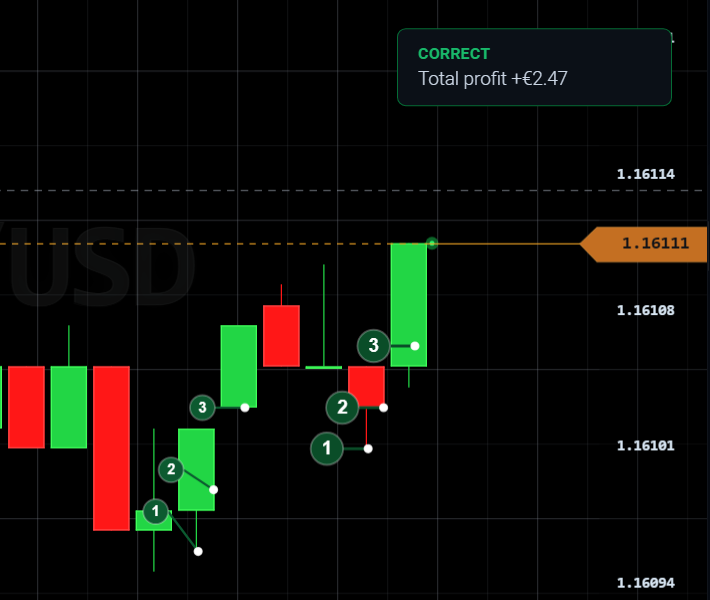
Trade result shown on the chart.
When a trade closes, the result is shown directly on the chart.
Total Portfolio panel.
Open trades, total invested, live P/L and potential return are collected here.
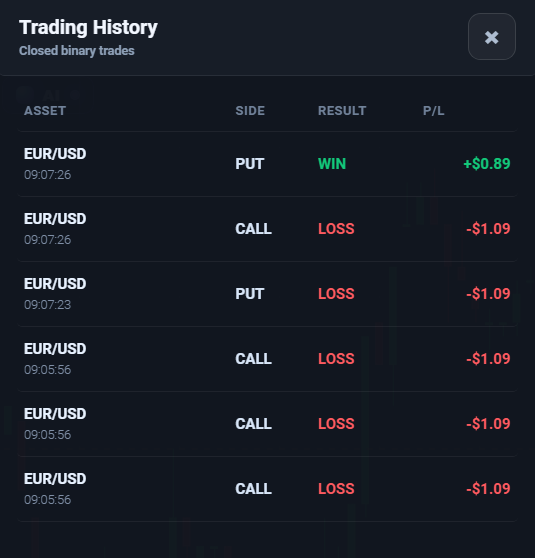
Trading History panel.
This is where you review closed trades and their outcomes.
09

User profile and AI Assistant

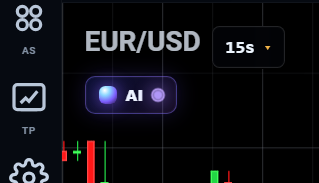
Open the profile to check verification status and balances. Use the AI button and AI panel to review contextual assistance about the current asset and latest trade.
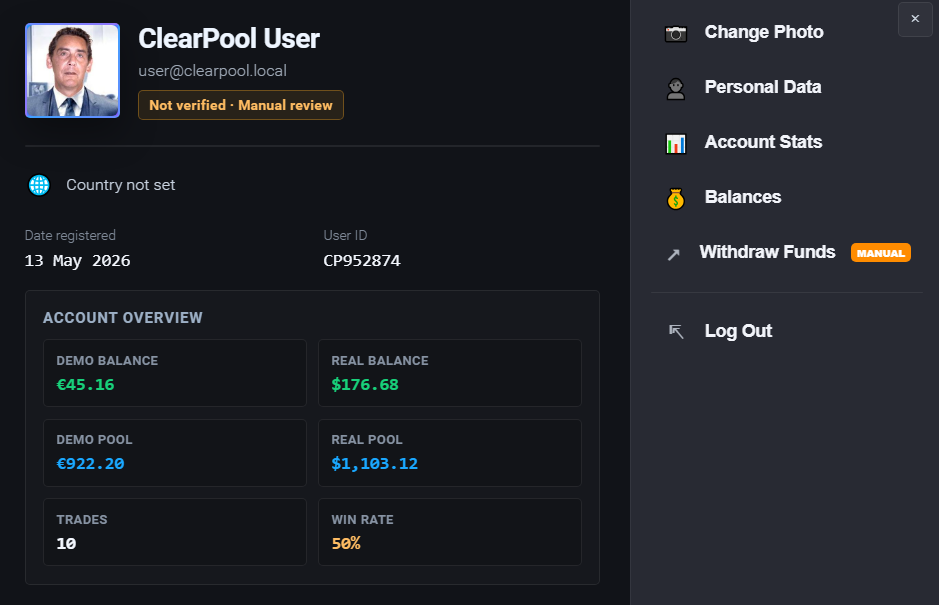
User profile overview.
The profile panel shows status, balances, Pool values, trades and win rate.
AI Assistant toggle near the chart.
Click this small button near the chart to open the AI Assistant.
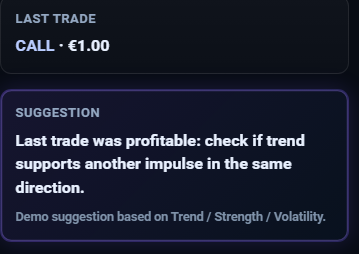
AI Assistant analysis panel.
The AI panel shows asset, timeframe, trend, strength, volatility and a contextual suggestion.
10

Chart reading tools

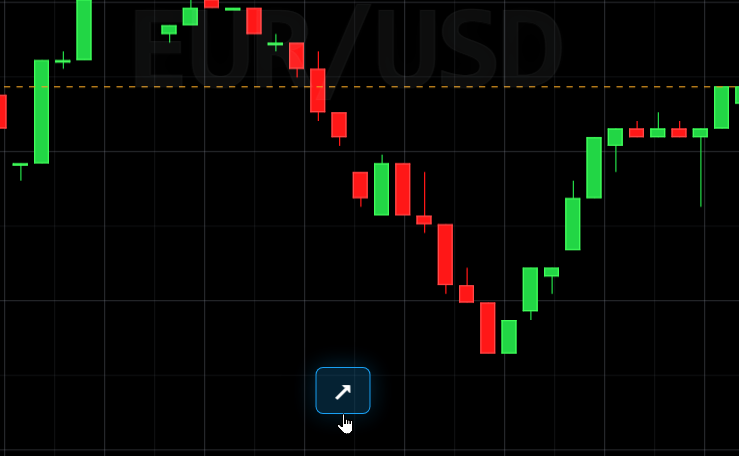
Read OHLC values by hovering a candle, use Focus to return to the active zone, and use Fit Chart to restore the chart framing.
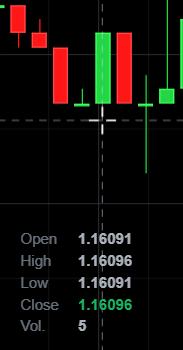
Candle OHLC hover data.
Move the cursor on a candle to see Open, High, Low, Close and Volume.
Focus button.
Focus button.
Focus returns the chart to the active operating area.
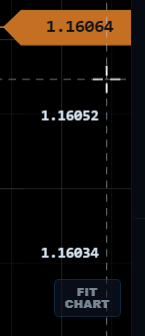
Fit Chart button.
Fit Chart button.
Fit Chart restores the chart scale and framing.
11

Graphic tools, indicators, settings and support

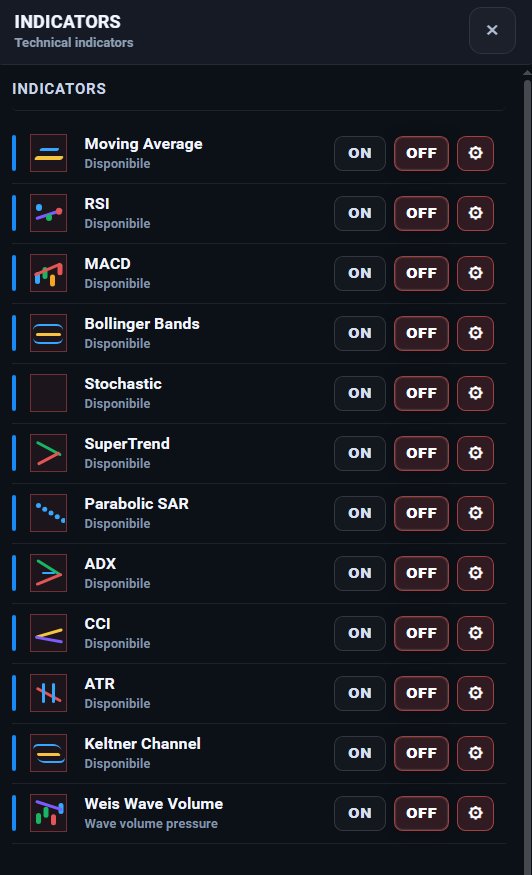
These sections give you drawing tools, technical indicators, platform preferences and direct support contacts.
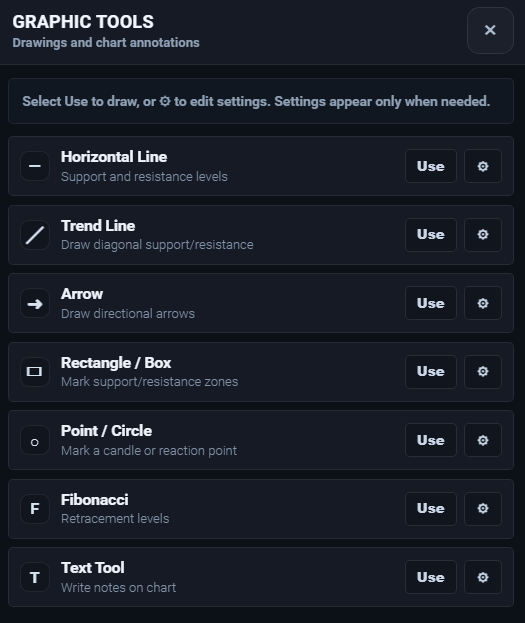
Graphic tools panel.
Draw lines, arrows, boxes, Fibonacci and text notes directly on the chart.
Technical indicators panel.
Turn indicators on or off and open their settings.
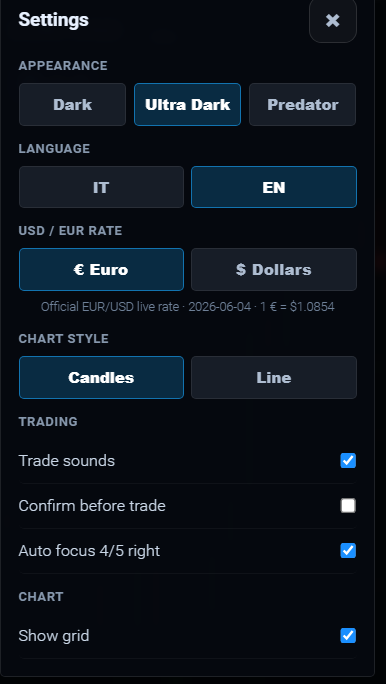
Settings panel.
Settings panel.
Theme, language, currency, sounds and chart options are managed here.
Support panel.
Support panel.
Here you find direct support contacts and the Telegram channel.